
The Leganto Librarian Analytics Reports 2022-2023 Focus Group was established to share current Analytics reporting practice and to explore institutions’ different operational and strategic reporting needs with a view to updating Leganto’s out-of-the-box reporting which is maintained by Ex libris to benefit all Library users.
After a call for expressions of interest from Leganto customers, participants included the following institutions:
- Charles Darwin University (Australia)
- LIUC Università Cattaneo (Italy)
- Rice University (TX, USA)
- Roberts Wesleyan College (NY, USA)
- Sikt/ BIBSYS (Norway)
- University of Edinburgh (Scotland, UK)
- University of Manchester (England, UK)
- University of Minnesota (MN, USA)
- University of Plymouth (England, UK)
- University of Sheffield (England, UK)
- University of Toronto (Canada)
- University of Western Sydney (Australia)
- University of York (England, UK)
From late June 2022, Focus Group members had individual meetings with Leganto Product Manager Dolav Ben-Artzi and Ex Libris colleagues to present their current Leganto analytics reports, and explain their local institutional context and reporting needs.
All focus group members were also invited to these sessions which helped to share best practice and discuss different approaches to reporting needs. These sessions continued until September 2022 after which Ex Libris identified common requirements in a summary report (IGeLU Login required), and then worked with the focus group to identify and develop new out-of-the-box reports.
Two main types of analytics reporting were identified:
- Day to day operational reports – A collection of quality customer-created reports on workflow and Leganto operations which will be added to the out-of-the-box set of reports and will be supported by Ex Libris.
- Advanced “big picture” strategic reports – A set of more advanced reports to measure and demonstrate library impact on teaching and learning more widely.
The group’s work completed in May 2023, and Ex libris developed a new set of Dashboards using Data Visualization for all customers to use which were rolled out from November 2023, accessible from the Analytics Catalog under Leganto > Data Visualization
New Dashboards
Based on the range of operational and strategic reporting discussed by the Leganto Librarian Analytics Reports Focus Group members Ex Libris released two new dashboards:
- Leganto Usage Dashboard (from November 2023)
- Leganto Student Savings Dashboard (from August 2024)
There are multiple tabs of reporting in each dashboard, with 1-3 reports per tab and filter options to drill down into more detail in some cases.
Leganto Usage
Dashboard tabs include:
- Course usage overview (November 2023) – overview of courses with lists and levels student usage
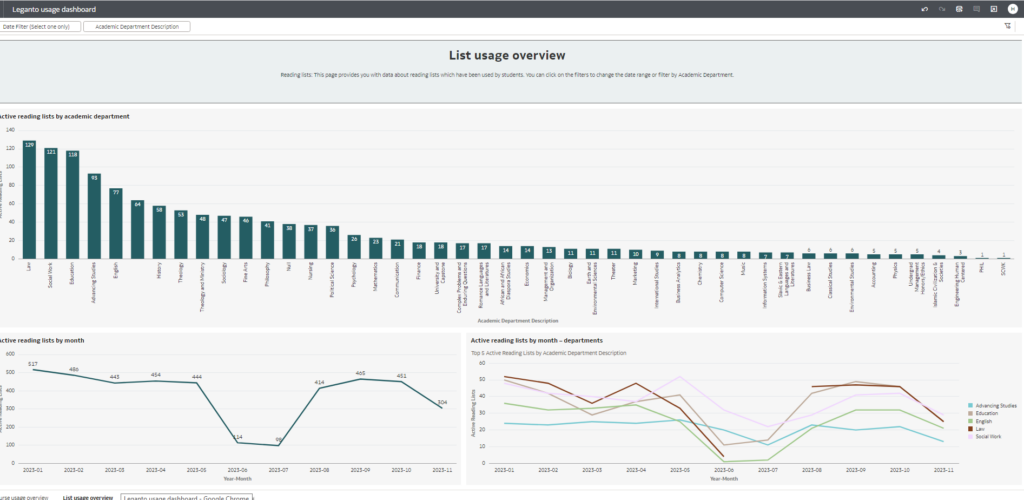
- List usage overview (January 2024) – displays graphic data about reading lists actively used by students over time
- Detailed list usage (March 2024) – displays detailed student usage measures data for courses
- Citation usage (April 2024) – displays a table with the citation-level data on student usage
- Weekly usage (November 2023) – displays graphic data on weekly student usage
- Year over year (April 2024) – Provides graphic information on Leganto usage over multiple years, with future projections.
For an introduction to this dashboard, please see the Ex Libris video: Leganto student usage dashboard – April 2024
Leganto Student Savings

Dashboard tabs (August 2024) include:
- Savings image (by Enrollment) – simple total of the estimated cost savings based on enrollment in courses that have reading lists
- Savings per year (by enrollment) – a graph of the estimated savings per year based on enrollment in courses that have reading lists. Students enrolled in several courses are counted for each course.
- Savings by enrollment – summary information and chart on the amount that students saved per course that have a reading list
- Savings image (by usage) – simple total of the estimated cost savings based on the number of students that accessed the materials for their course in Leganto
- Savings per year (by usage) – a graph of the estimated cost savings per year based on the number of students that accessed the materials for their course in Leganto
- Savings by usage – summary information and chart on the amount that students saved per course, based on the number of students that accessed the materials for their course in Leganto
For an introduction to this dashboard please see the Ex Libris video: Leganto Student Savings Dashboard – August 2024
Further Work and other developments
Future releases beyond 2024 will see additional reporting added to the Dashboards.
Separately to the Focus Group’s work, additional Dashboard reporting has been developed for Rialto users which also touches on course-related Rialto acquisitions activity relevant to Leganto users.
From the June 2024 release, the Rialto Use and Cost dashboard had a new tab “Rialto Resources for Active Courses” – which displays a graph showing the annual number and value of orders for active courses, together with a table providing detailed information on active courses (based on the shared Bibliographic Details dimension in the Purchase Requests Subject Area.)